Exploring the intricate details of your big data sets can be frustrating when your tools do not provide you with the functionality you require to go deeper into your data.
Luckily, complicated date pickers are now a thing of the past.
Skip the impossible calendars and drop downs that are too small to humanly navigate for a more intuitive way to explore every part your data, with time charts from ZoomCharts.
This is the third installment in the new ZoomCharts experience video series.
These video shorts will continue on a regular basis to offer a fun, fast, and entertaining way to showcase ZoomCharts’ unique capabilities.
Follow the video series to discover how ZoomCharts tools can be used to enhance your data visualization possibilities.
Check out ZoomCharts products:
Network Chart
Big network exploration
Explore linked data sets. Highlight relevant data with dynamic filters and visual styles. Incremental data loading. Exploration with focus nodes.
Time Chart
Time navigation and exploration tool
Browse activity logs, select time ranges. Multiple data series and value axes. Switch between time units.
Pie Chart
Amazingly intuitive hierarchical data exploration
Get quick overview of your data and drill down when necessary. All in a single easy to use chart.
Facet Chart
Scrollable bar chart with drill-down
Compare values side by side and provide easy access to the long tail.
ZoomCharts
http://www.zoomcharts.com
The world’s most interactive data visualization software

Showing posts with label data visualization. Show all posts
Showing posts with label data visualization. Show all posts
Friday, May 22, 2015

Monday, May 18, 2015
Interactive SDK ZoomCharts Facet Chart Browser Shares, Hierarchical Structure
https://zoomcharts.com/en/gallery/all:facet-chart-browser-shares
Data visualization or data visualisation is viewed by many disciplines as a modern equivalent of visual communication. It is not owned by any one field, but rather finds interpretation across many (e.g. it is viewed as a modern branch of descriptive statistics by some, but also as a grounded theory development tool by others). It involves the creation and study of the visual representation of data, meaning "information that has been abstracted in some schematic form, including attributes or variables for the units of information".
A primary goal of data visualization is to communicate information clearly and efficiently to users via the statistical graphics, plots, information graphics, tables, and charts selected. Effective visualization helps users in analyzing and reasoning about data and evidence. It makes complex data more accessible, understandable and usable. Users may have particular analytical tasks, such as making comparisons or understanding causality, and the design principle of the graphic (i.e., showing comparisons or showing causality) follows the task. Tables are generally used where users will look-up a specific measure of a variable, while charts of various types are used to show patterns or relationships in the data for one or more variables.
Data visualization is both an art and a science. The rate at which data is generated has increased, driven by an increasingly information-based economy. Data created by internet activity and an expanding number of sensors in the environment, such as satellites and traffic cameras, are referred to as "Big Data". Processing, analyzing and communicating this data present a variety of ethical and analytical challenges for data visualization. The field of data science and practitioners called data scientists have emerged to help address this challenge.
The Facet Chart Hierarchical Structure tool, part of ZoomCharts’ advanced data visualization line of software, makes presenting and analyzing large amounts of data simple and visually appealing. Work more efficiently with your data by organizing it to fit your company’s exact needs.
Hierarchical Structure is one of the many advanced data visualization features being offered by ZoomCharts and used by clients in several educational fields, including sciences and mathematics, such as anatomy, biochemistry, ecology, microbiology, nutrition, neuroscience, physiology, zoology, chemical engineering, geochemistry, molecular biology, geology, paleontology, physics, astronomy, algebra, computer science, geometry, logic, and statistics, and the arts such as, music, dance, theatre, film, animation, architecture, applied arts, photography, graphic design, interior design, and mixed media.
- Interactive data representation lets you visualize large amounts of information
- View data in hierarchical order for an organized display
- Present detailed information about your data series easily and efficiently
Check out ZoomCharts products:
Network Chart
Big network exploration
Explore linked data sets. Highlight relevant data with dynamic filters and visual styles. Incremental data loading. Exploration with focus nodes.
Time Chart
Time navigation and exploration tool
Browse activity logs, select time ranges. Multiple data series and value axes. Switch between time units.
Pie Chart
Amazingly intuitive hierarchical data exploration
Get quick overview of your data and drill down when necessary. All in a single easy to use chart.
Facet Chart
Scrollable bar chart with drill-down
Compare values side by side and provide easy access to the long tail.
ZoomCharts
http://www.zoomcharts.com
The world’s most interactive data visualization software
How to use ZoomCharts Facet Chart - Browser Shares, Hierarchical Structure for Tablet
https://zoomcharts.com/en/gallery/all:facet-chart-browser-shares
The Facet Chart Hierarchical Structure tool, part of ZoomCharts’ advanced data visualization line of software, makes presenting and analyzing large amounts of data simple and visually appealing. Work more efficiently with your data by organizing it to fit your company’s exact needs.
Hierarchical Structure is one of the many advanced data visualization features being offered by ZoomCharts and used by clients in several educational fields, including sciences and mathematics, such as anatomy, biochemistry, ecology, microbiology, nutrition, neuroscience, physiology, zoology, chemical engineering, geochemistry, molecular biology, geology, paleontology, physics, astronomy, algebra, computer science, geometry, logic, and statistics, and the arts such as, music, dance, theatre, film, animation, architecture, applied arts, photography, graphic design, interior design, and mixed media.
- Interactive data representation lets you visualize large amounts of information
- View data in hierarchical order for an organized display
- Present detailed information about your data series easily and efficiently
Step 1 Order your chart’s data by hierarchy.

Step 2 Hover over a data series to display detailed information.

Step 3 Click on a data series to expand.

Step 4 Zoom in and out of the chart by swiping up or down with your mouse scroll pad, or by using the Zoom-out feature at the top left.

Step 5 Go back to the full data display using the Back feature at the top left.

Check out ZoomCharts products:
Network Chart
Big network exploration
Explore linked data sets. Highlight relevant data with dynamic filters and visual styles. Incremental data loading. Exploration with focus nodes.
Time Chart
Time navigation and exploration tool
Browse activity logs, select time ranges. Multiple data series and value axes. Switch between time units.
Pie Chart
Amazingly intuitive hierarchical data exploration
Get quick overview of your data and drill down when necessary. All in a single easy to use chart.
Facet Chart
Scrollable bar chart with drill-down
Compare values side by side and provide easy access to the long tail.
ZoomCharts
http://www.zoomcharts.com
The world’s most interactive data visualization software
The Facet Chart Hierarchical Structure tool, part of ZoomCharts’ advanced data visualization line of software, makes presenting and analyzing large amounts of data simple and visually appealing. Work more efficiently with your data by organizing it to fit your company’s exact needs.
Hierarchical Structure is one of the many advanced data visualization features being offered by ZoomCharts and used by clients in several educational fields, including sciences and mathematics, such as anatomy, biochemistry, ecology, microbiology, nutrition, neuroscience, physiology, zoology, chemical engineering, geochemistry, molecular biology, geology, paleontology, physics, astronomy, algebra, computer science, geometry, logic, and statistics, and the arts such as, music, dance, theatre, film, animation, architecture, applied arts, photography, graphic design, interior design, and mixed media.
- Interactive data representation lets you visualize large amounts of information
- View data in hierarchical order for an organized display
- Present detailed information about your data series easily and efficiently
Step 1 Order your chart’s data by hierarchy.
Step 2 Hover over a data series to display detailed information.
Step 3 Click on a data series to expand.
Step 4 Zoom in and out of the chart by swiping up or down with your mouse scroll pad, or by using the Zoom-out feature at the top left.
Step 5 Go back to the full data display using the Back feature at the top left.
Check out ZoomCharts products:
Network Chart
Big network exploration
Explore linked data sets. Highlight relevant data with dynamic filters and visual styles. Incremental data loading. Exploration with focus nodes.
Time Chart
Time navigation and exploration tool
Browse activity logs, select time ranges. Multiple data series and value axes. Switch between time units.
Pie Chart
Amazingly intuitive hierarchical data exploration
Get quick overview of your data and drill down when necessary. All in a single easy to use chart.
Facet Chart
Scrollable bar chart with drill-down
Compare values side by side and provide easy access to the long tail.
ZoomCharts
http://www.zoomcharts.com
The world’s most interactive data visualization software
Wednesday, April 8, 2015
ZoomCharts Facebook Contest Winner

What a success ZoomCharts Facebook contest was!
https://www.facebook.com/zoomcharts/photos/a.682071635210049.1073741828.611071555643391/796714023745809/?type=1&theater
On March 31st, 2015 ZoomCharts selected and now is proud to announce the lucky winner of the ZoomCharts Developer License, valued at $699 USD: Asim Ibrahim!
Asim Ibrahim is now part of the growing number of professionals using ZoomCharts tools to create fully interactive, stunning visual representations of big data sets on all modern devices at incredibly fast speeds.
A big congratulations to Asim Ibrahim! Enjoy the exciting possibilities that ZoomCharts tools have in unlocking the potential of your data!
Check out ZoomCharts products:
Network Chart
Big network exploration
Explore linked data sets. Highlight relevant data with dynamic filters and visual styles. Incremental data loading. Exploration with focus nodes.
Time Chart
Time navigation and exploration tool
Browse activity logs, select time ranges. Multiple data series and value axes. Switch between time units.
Pie Chart
Amazingly intuitive hierarchical data exploration
Get quick overview of your data and drill down when necessary. All in a single easy to use chart.
Facet Chart
Scrollable bar chart with drill-down
Compare values side by side and provide easy access to the long tail.
ZoomCharts
http://www.zoomcharts.com
The world’s most interactive data visualization software
Tuesday, April 7, 2015
Try ZoomCharts JavaScript Data Visualization Tools for FREE
Looking for an HTML chart library that lets you visualize massive data sets interactively on any device at incredibly fast speeds?

Data visualization providers out there that offer similar toolsets fall short in one area, or many, such as charts that support big data with slow loading times, beautiful visuals without practical function, or intricate chart capabilities without the option to take your data with you on mobile.
When you’re looking for a data visualization solution that has it all, ZoomCharts rises up clear above the competition.
• Free demos
Many providers don’t really let you know what you’re getting into before getting very involved, with videos that show you how the product is supposed to work, but without actually letting you test it out for yourself.
Because we know that you need to know exactly what you can expect from the software before you start a trial, download an app, or purchase software outright, ZoomCharts offers free interactive demos right from the homepage. They are easy to access, allow you to play around with the tools, and let you know exactly what the tools are capable of without having to commit to anything.
You can explore the intricacies of each chart type with dozens of interactive chart examples in the Gallery, and even fun examples right on the homepage.
• 100% Interactive and functional charts
Many charts offer eye catching visuals that make your data pretty, but often, it’s more style than substance.
Visualizing data is about much more than making it look nice. Beyond being visually appealing, animations that make your data sets fade, blink, bounce, or do things they wouldn’t normally do, don’t serve a purpose.
With ZoomCharts, visual appeal and functionality are not mutually exclusive. You can bring your data to life with intuitive, zoomable and clickable charts that let you drill down deeper into your data seamlessly.
• BIG data support and speed
For simple data needs, most data visualization tools on the market today will suffice, but professional businesses today require tools that support the massive amount of data we generate every minute.
ZoomCharts tools are capable of handling large data sets, without compromising performance. There is no lag time, and unlike many competitors, no waiting for data to load. Explore your big data while still maintaining the seamless interactions and transitions you can expect from smaller data sets with ZoomCharts.
• Mobile Use and Responsiveness
Many well established HTML chart library providers fail to bring their tools into today’s fast changing technical world that relies on responsive, mobile data.
Part of what brought ZoomCharts into existence was the recognition that no tool out there existed that provided the best of every world: highly capable tools that could not only support complex data sets, but could also be supported on every modern device.
Take your data with you on the go with ZoomCharts charts. All charts all 100% responsive, adjusting to whatever screen size you are working with, whether it is a desktop, laptop, tablet, or smart phone.
• Affordable
When it comes to your business needs, cost can be a major deciding factor in choosing your tools.
ZoomCharts offers fair pricing, with developer tools that start at $699, well under what some other competitors offer.
With ZoomCharts, you can ensure that you are getting tools that support your every business need, without unnecessary extra bells and whistles that drive up the price and often go unused anyway.
Try a FREE 30 day ZoomCharts trial today! ZoomCharts charts and graphs are 100% interactive and very intuitive: https://zoomcharts.com/en/gallery/
Check out ZoomCharts products:
Network Chart
Big network exploration
Explore linked data sets. Highlight relevant data with dynamic filters and visual styles. Incremental data loading. Exploration with focus nodes.
Time Chart
Time navigation and exploration tool
Browse activity logs, select time ranges. Multiple data series and value axes. Switch between time units.
Pie Chart
Amazingly intuitive hierarchical data exploration
Get quick overview of your data and drill down when necessary. All in a single easy to use chart.
Facet Chart
Scrollable bar chart with drill-down
Compare values side by side and provide easy access to the long tail.
ZoomCharts
http://www.zoomcharts.com
The world’s most interactive data visualization software
Data visualization providers out there that offer similar toolsets fall short in one area, or many, such as charts that support big data with slow loading times, beautiful visuals without practical function, or intricate chart capabilities without the option to take your data with you on mobile.
When you’re looking for a data visualization solution that has it all, ZoomCharts rises up clear above the competition.
• Free demos
Many providers don’t really let you know what you’re getting into before getting very involved, with videos that show you how the product is supposed to work, but without actually letting you test it out for yourself.
Because we know that you need to know exactly what you can expect from the software before you start a trial, download an app, or purchase software outright, ZoomCharts offers free interactive demos right from the homepage. They are easy to access, allow you to play around with the tools, and let you know exactly what the tools are capable of without having to commit to anything.
You can explore the intricacies of each chart type with dozens of interactive chart examples in the Gallery, and even fun examples right on the homepage.
• 100% Interactive and functional charts
Many charts offer eye catching visuals that make your data pretty, but often, it’s more style than substance.
Visualizing data is about much more than making it look nice. Beyond being visually appealing, animations that make your data sets fade, blink, bounce, or do things they wouldn’t normally do, don’t serve a purpose.
With ZoomCharts, visual appeal and functionality are not mutually exclusive. You can bring your data to life with intuitive, zoomable and clickable charts that let you drill down deeper into your data seamlessly.
• BIG data support and speed
For simple data needs, most data visualization tools on the market today will suffice, but professional businesses today require tools that support the massive amount of data we generate every minute.
ZoomCharts tools are capable of handling large data sets, without compromising performance. There is no lag time, and unlike many competitors, no waiting for data to load. Explore your big data while still maintaining the seamless interactions and transitions you can expect from smaller data sets with ZoomCharts.
• Mobile Use and Responsiveness
Many well established HTML chart library providers fail to bring their tools into today’s fast changing technical world that relies on responsive, mobile data.
Part of what brought ZoomCharts into existence was the recognition that no tool out there existed that provided the best of every world: highly capable tools that could not only support complex data sets, but could also be supported on every modern device.
Take your data with you on the go with ZoomCharts charts. All charts all 100% responsive, adjusting to whatever screen size you are working with, whether it is a desktop, laptop, tablet, or smart phone.
• Affordable
When it comes to your business needs, cost can be a major deciding factor in choosing your tools.
ZoomCharts offers fair pricing, with developer tools that start at $699, well under what some other competitors offer.
With ZoomCharts, you can ensure that you are getting tools that support your every business need, without unnecessary extra bells and whistles that drive up the price and often go unused anyway.
Try a FREE 30 day ZoomCharts trial today! ZoomCharts charts and graphs are 100% interactive and very intuitive: https://zoomcharts.com/en/gallery/
Check out ZoomCharts products:
Network Chart
Big network exploration
Explore linked data sets. Highlight relevant data with dynamic filters and visual styles. Incremental data loading. Exploration with focus nodes.
Time Chart
Time navigation and exploration tool
Browse activity logs, select time ranges. Multiple data series and value axes. Switch between time units.
Pie Chart
Amazingly intuitive hierarchical data exploration
Get quick overview of your data and drill down when necessary. All in a single easy to use chart.
Facet Chart
Scrollable bar chart with drill-down
Compare values side by side and provide easy access to the long tail.
ZoomCharts
http://www.zoomcharts.com
The world’s most interactive data visualization software
Monday, April 6, 2015
One of the Most Powerful Data Visualization Tools in the World
ZoomCharts is enjoying international recognition, with impressed users as far reaching as countries such as Thailand.

An increasing number of professionals in the world of business, technology, government, education, and more are discovering ZoomCharts, the world’s most interactive data visualization software, with completely interactive charts and graphs that support massive amounts of data, can be used with all modern touchscreen devices, and perform at incredibly fast speeds.
Thailand’s Next Flow, a group of creative technology experts, recommends ZoomCharts. Next Flow specializes in training users to save time by using technology most efficiently and effectively. And they use best tools that help them to achieve these goals of working faster and smarter.
Satisfied users of the software themselves, Next Flow dubs ZoomCharts tools to be among the best in the data visualization market. In a world where interactive HTML data visualization tools are widely available, they name it one of the most powerful, and visual providers.
Check out Next Flow at http://nextflow.in.th
Check out ZoomCharts products:
Network Chart
Big network exploration
Explore linked data sets. Highlight relevant data with dynamic filters and visual styles. Incremental data loading. Exploration with focus nodes.
Time Chart
Time navigation and exploration tool
Browse activity logs, select time ranges. Multiple data series and value axes. Switch between time units.
Pie Chart
Amazingly intuitive hierarchical data exploration
Get quick overview of your data and drill down when necessary. All in a single easy to use chart.
Facet Chart
Scrollable bar chart with drill-down
Compare values side by side and provide easy access to the long tail.
ZoomCharts
http://www.zoomcharts.com
The world’s most interactive data visualization software
An increasing number of professionals in the world of business, technology, government, education, and more are discovering ZoomCharts, the world’s most interactive data visualization software, with completely interactive charts and graphs that support massive amounts of data, can be used with all modern touchscreen devices, and perform at incredibly fast speeds.
Thailand’s Next Flow, a group of creative technology experts, recommends ZoomCharts. Next Flow specializes in training users to save time by using technology most efficiently and effectively. And they use best tools that help them to achieve these goals of working faster and smarter.
Satisfied users of the software themselves, Next Flow dubs ZoomCharts tools to be among the best in the data visualization market. In a world where interactive HTML data visualization tools are widely available, they name it one of the most powerful, and visual providers.
Check out Next Flow at http://nextflow.in.th
Check out ZoomCharts products:
Network Chart
Big network exploration
Explore linked data sets. Highlight relevant data with dynamic filters and visual styles. Incremental data loading. Exploration with focus nodes.
Time Chart
Time navigation and exploration tool
Browse activity logs, select time ranges. Multiple data series and value axes. Switch between time units.
Pie Chart
Amazingly intuitive hierarchical data exploration
Get quick overview of your data and drill down when necessary. All in a single easy to use chart.
Facet Chart
Scrollable bar chart with drill-down
Compare values side by side and provide easy access to the long tail.
ZoomCharts
http://www.zoomcharts.com
The world’s most interactive data visualization software
Wednesday, April 1, 2015
ZoomCharts Makes it Easy to Drill Down Into Your Data

This is the first installment in the new ZoomCharts Experience video series. These video shorts will continue on a regular basis to offer a fun, fast, and entertaining way to showcase ZoomCharts’ unique capabilities.
Tired of static data charts that don’t let you go deeper into the information you need to access?
ZoomCharts makes it easy to drill down into your data, with interactive swiping and pinching features that let you easily scroll, zoom in, and zoom out to let you explore every part of your data, in one space.
Everything you need is available to you literally right at your fingertips.
Subscribe to the ZoomCharts Youtube channel and follow the video series to discover how ZoomCharts tools can be used to enhance your data visualization possibilities:
https://www.youtube.com/channel/UCWcwkDLDB_3SNJJPAsWOTPg
Feel free to explore how the chart works - it is 100% interactive and very intuitive to use.
ZoomCharts Time Chart - Mixed - Columns and Area
https://zoomcharts.com/embed?url=/en/gallery/all:mixed-timechart-columns-area-bitcoin-transactions-gradient
Check out ZoomCharts products:
Network Chart
Big network exploration
Explore linked data sets. Highlight relevant data with dynamic filters and visual styles. Incremental data loading. Exploration with focus nodes.
Time Chart
Time navigation and exploration tool
Browse activity logs, select time ranges. Multiple data series and value axes. Switch between time units.
Pie Chart
Amazingly intuitive hierarchical data exploration
Get quick overview of your data and drill down when necessary. All in a single easy to use chart.
Facet Chart
Scrollable bar chart with drill-down
Compare values side by side and provide easy access to the long tail.
ZoomCharts
http://www.zoomcharts.com
The world’s most interactive data visualization software
Tuesday, March 31, 2015
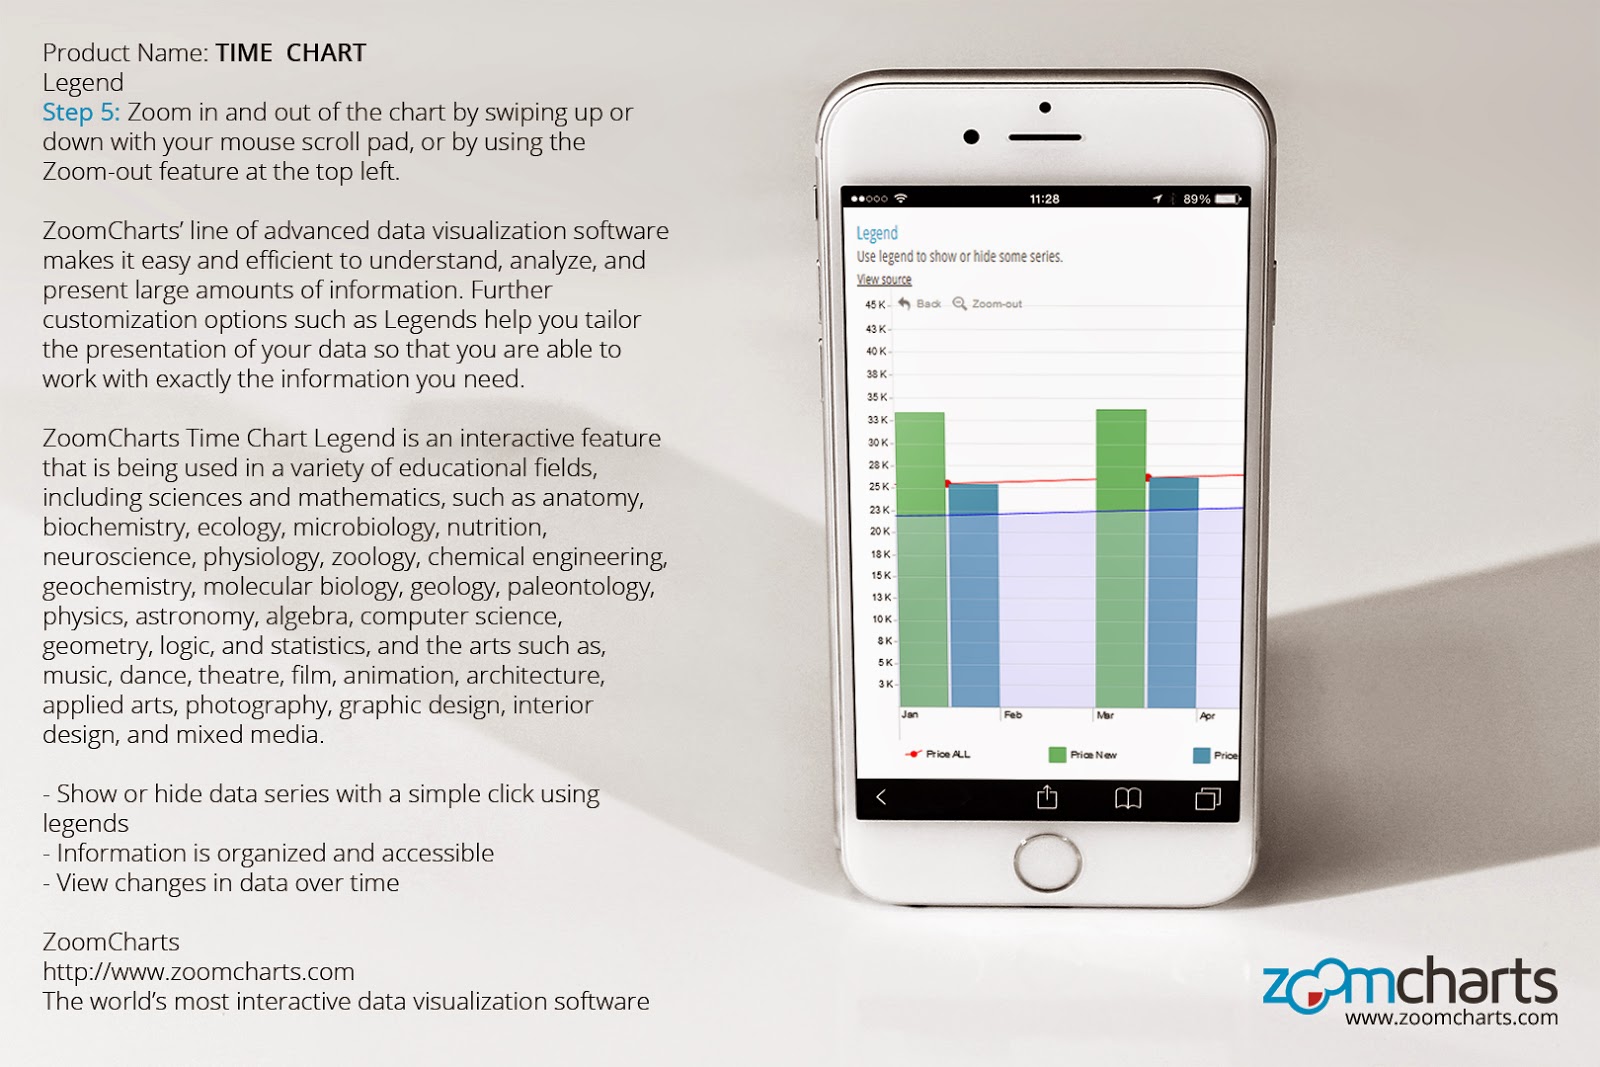
How to Use ZoomCharts Time Chart Legend on iPhone
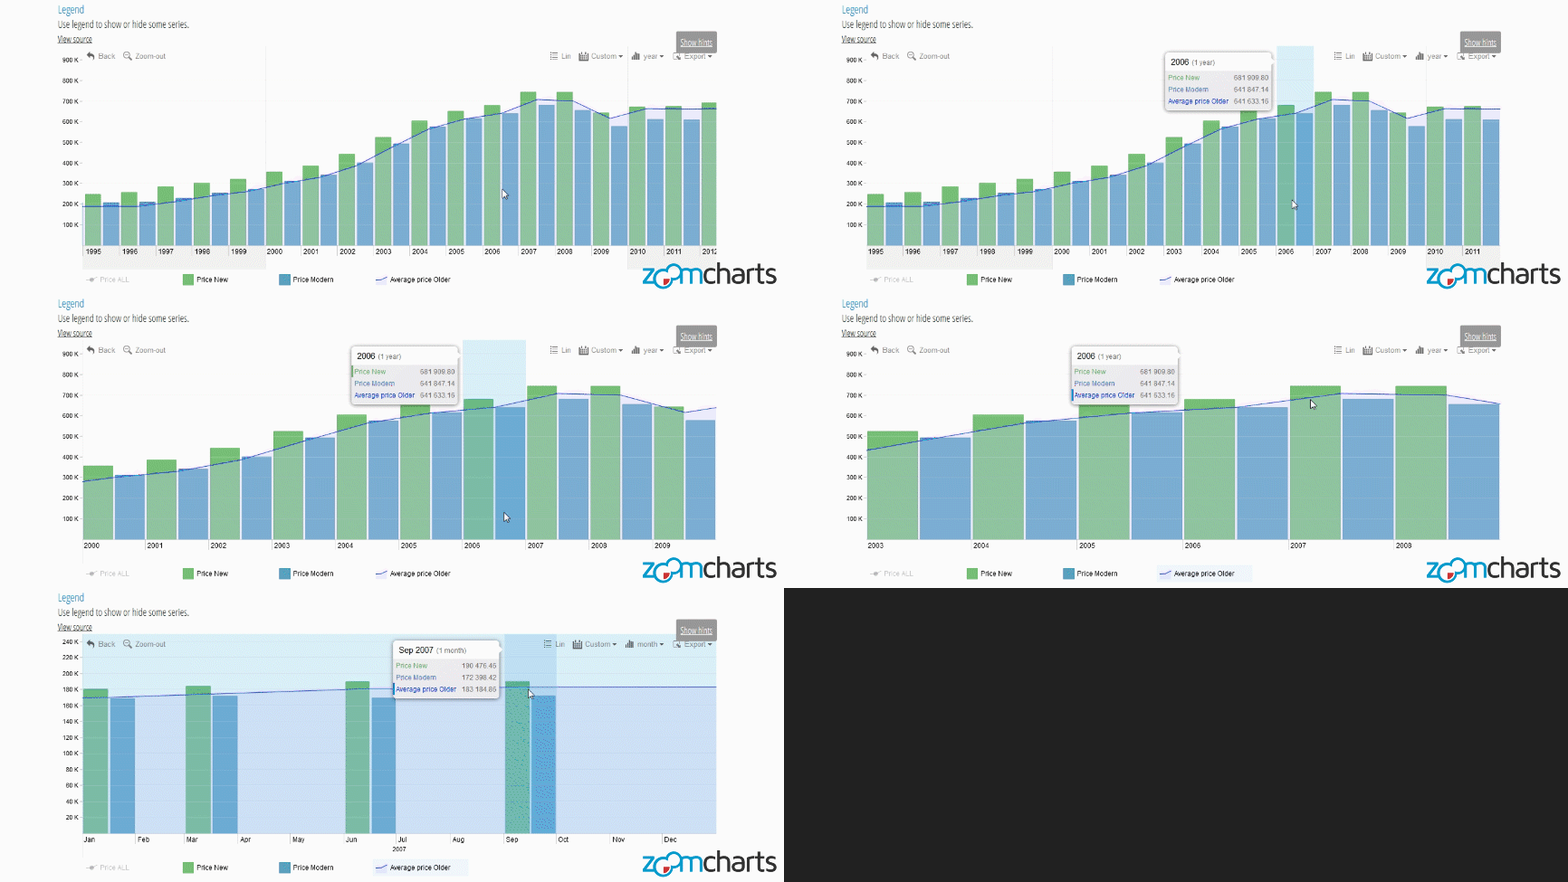
https://zoomcharts.com/en/gallery/all:time-chart-legend
ZoomCharts’ line of advanced data visualization software makes it easy and efficient to understand, analyze, and present large amounts of information. Further customization options such as Legends help you tailor the presentation of your data so that you are able to work with exactly the information you need.
ZoomCharts Time Chart Legend is an interactive feature that is being used in a variety of educational fields, including sciences and mathematics, such as anatomy, biochemistry, ecology, microbiology, nutrition, neuroscience, physiology, zoology, chemical engineering, geochemistry, molecular biology, geology, paleontology, physics, astronomy, algebra, computer science, geometry, logic, and statistics, and the arts such as, music, dance, theatre, film, animation, architecture, applied arts, photography, graphic design, interior design, and mixed media.
- Show or hide data series with a simple click using legends
- Information is organized and accessible
- View changes in data over time
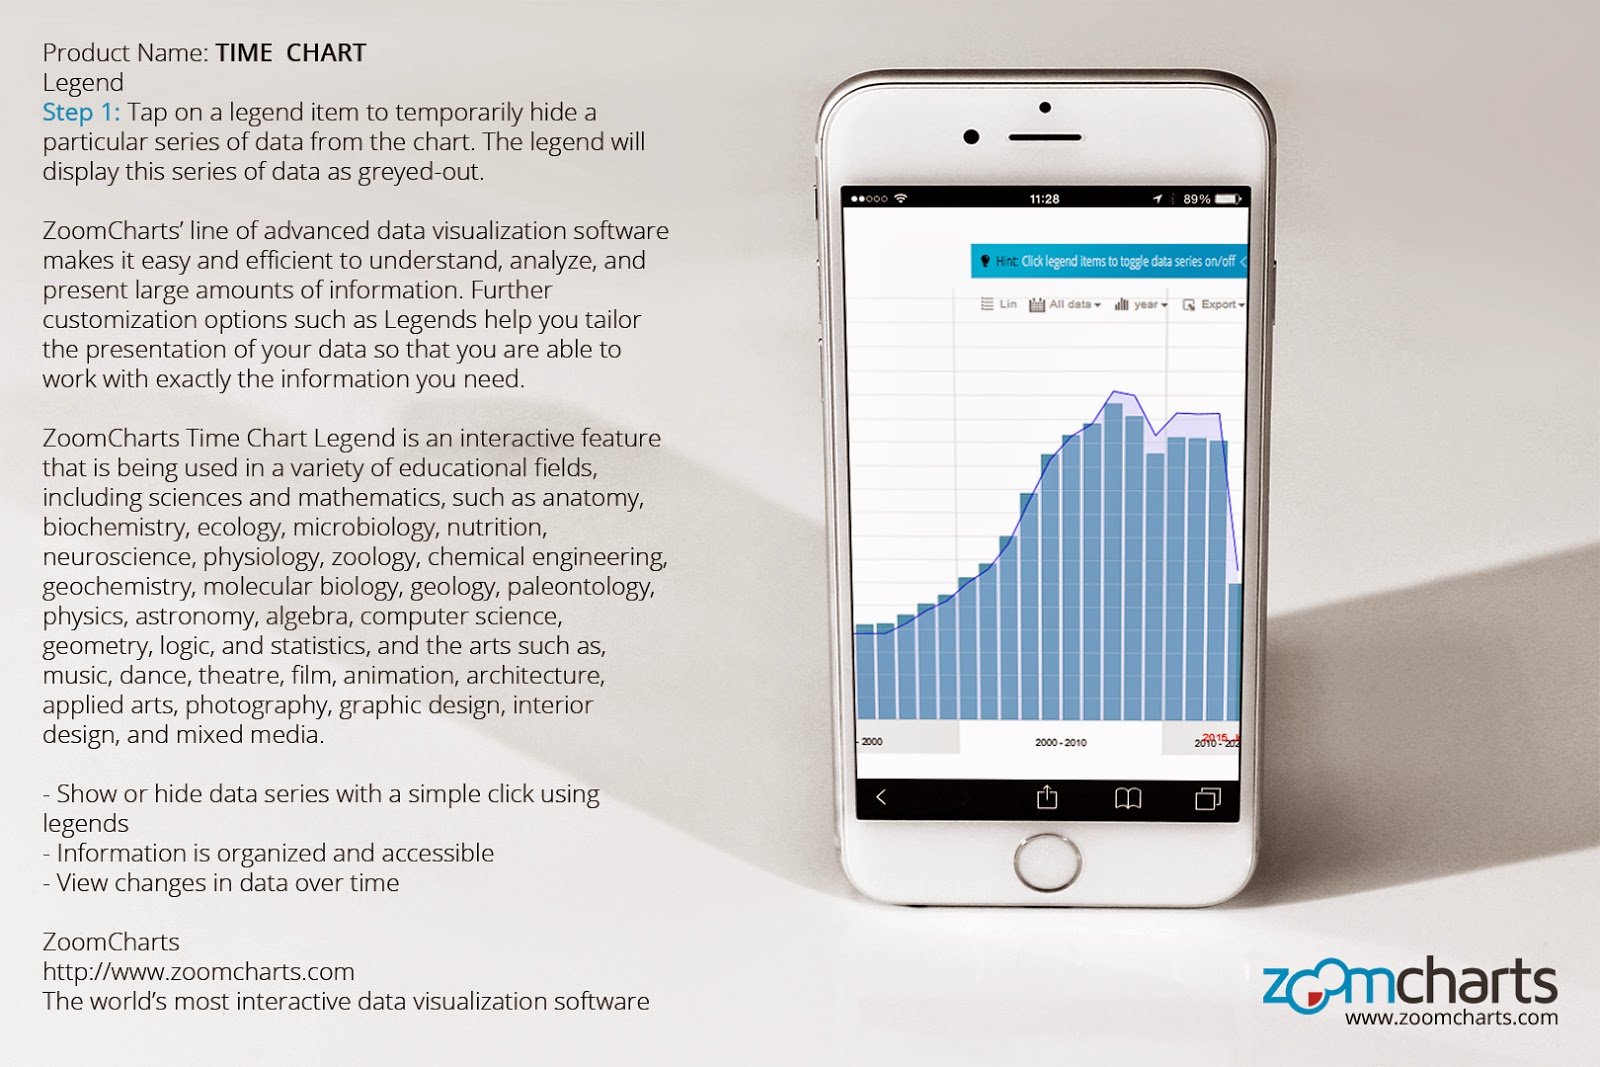
Step 1 Tap on a legend item to temporarily hide a particular series of data from the chart. The legend will display this series of data as greyed-out.
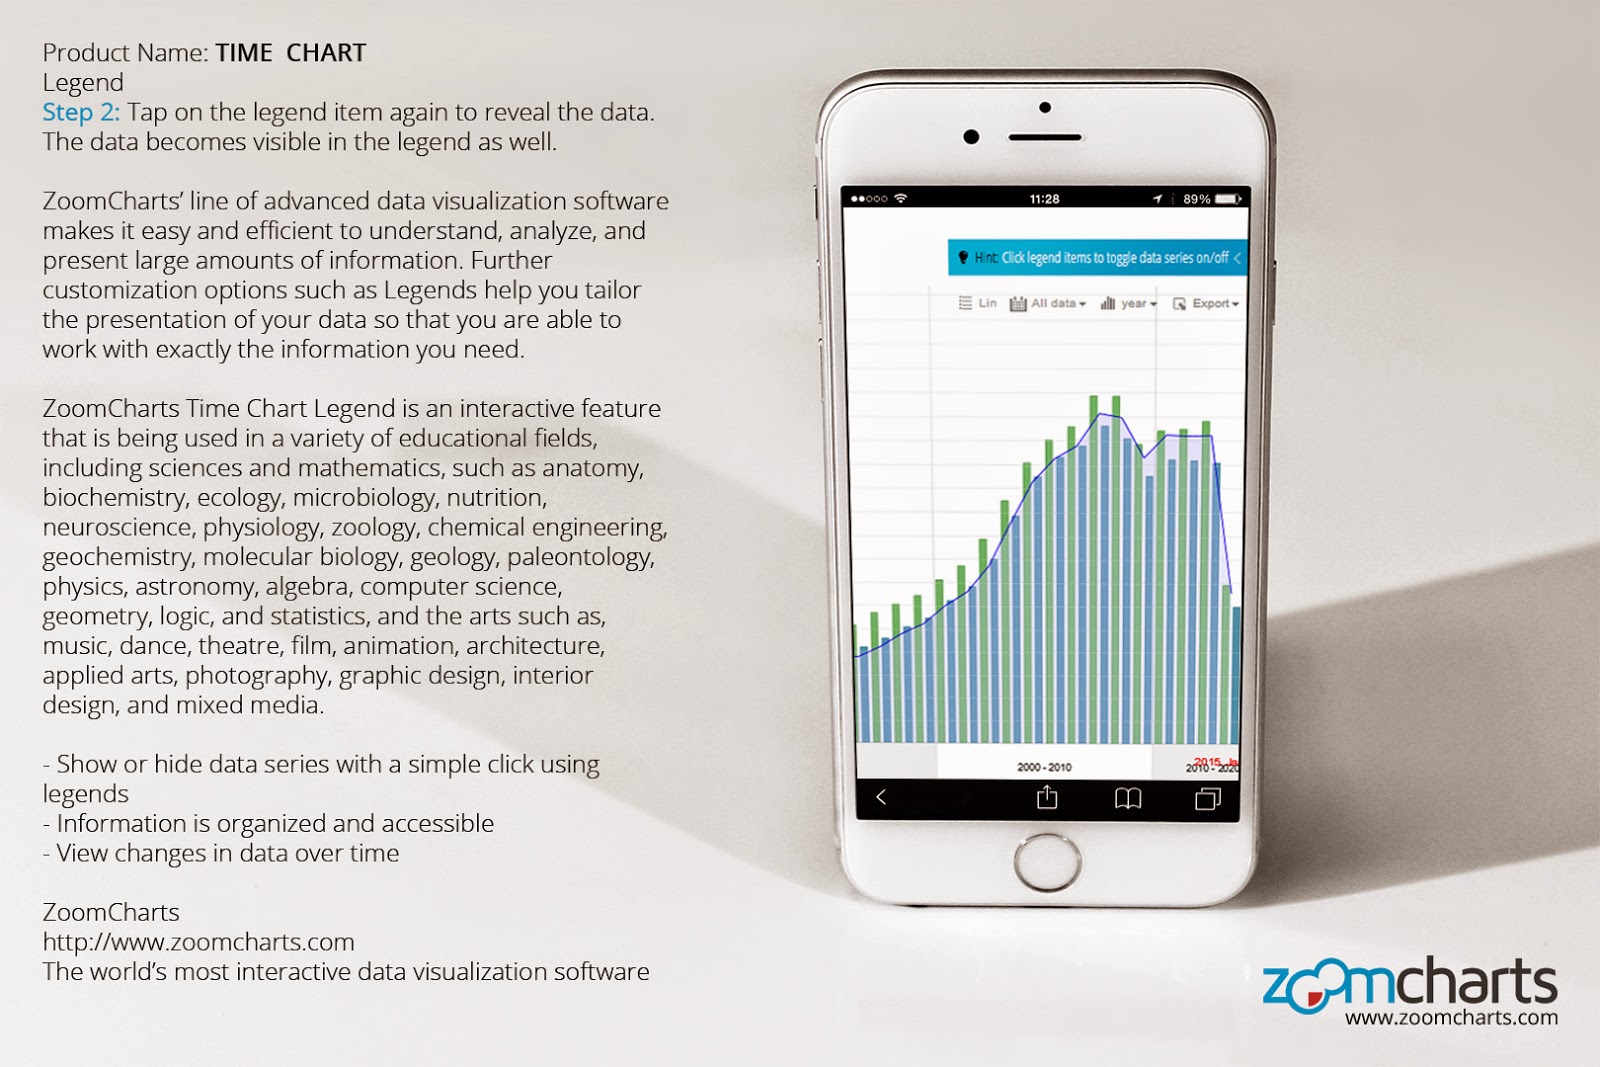
Step 2 Tap on the legend item again to reveal the data. The data becomes visible in the legend as well.
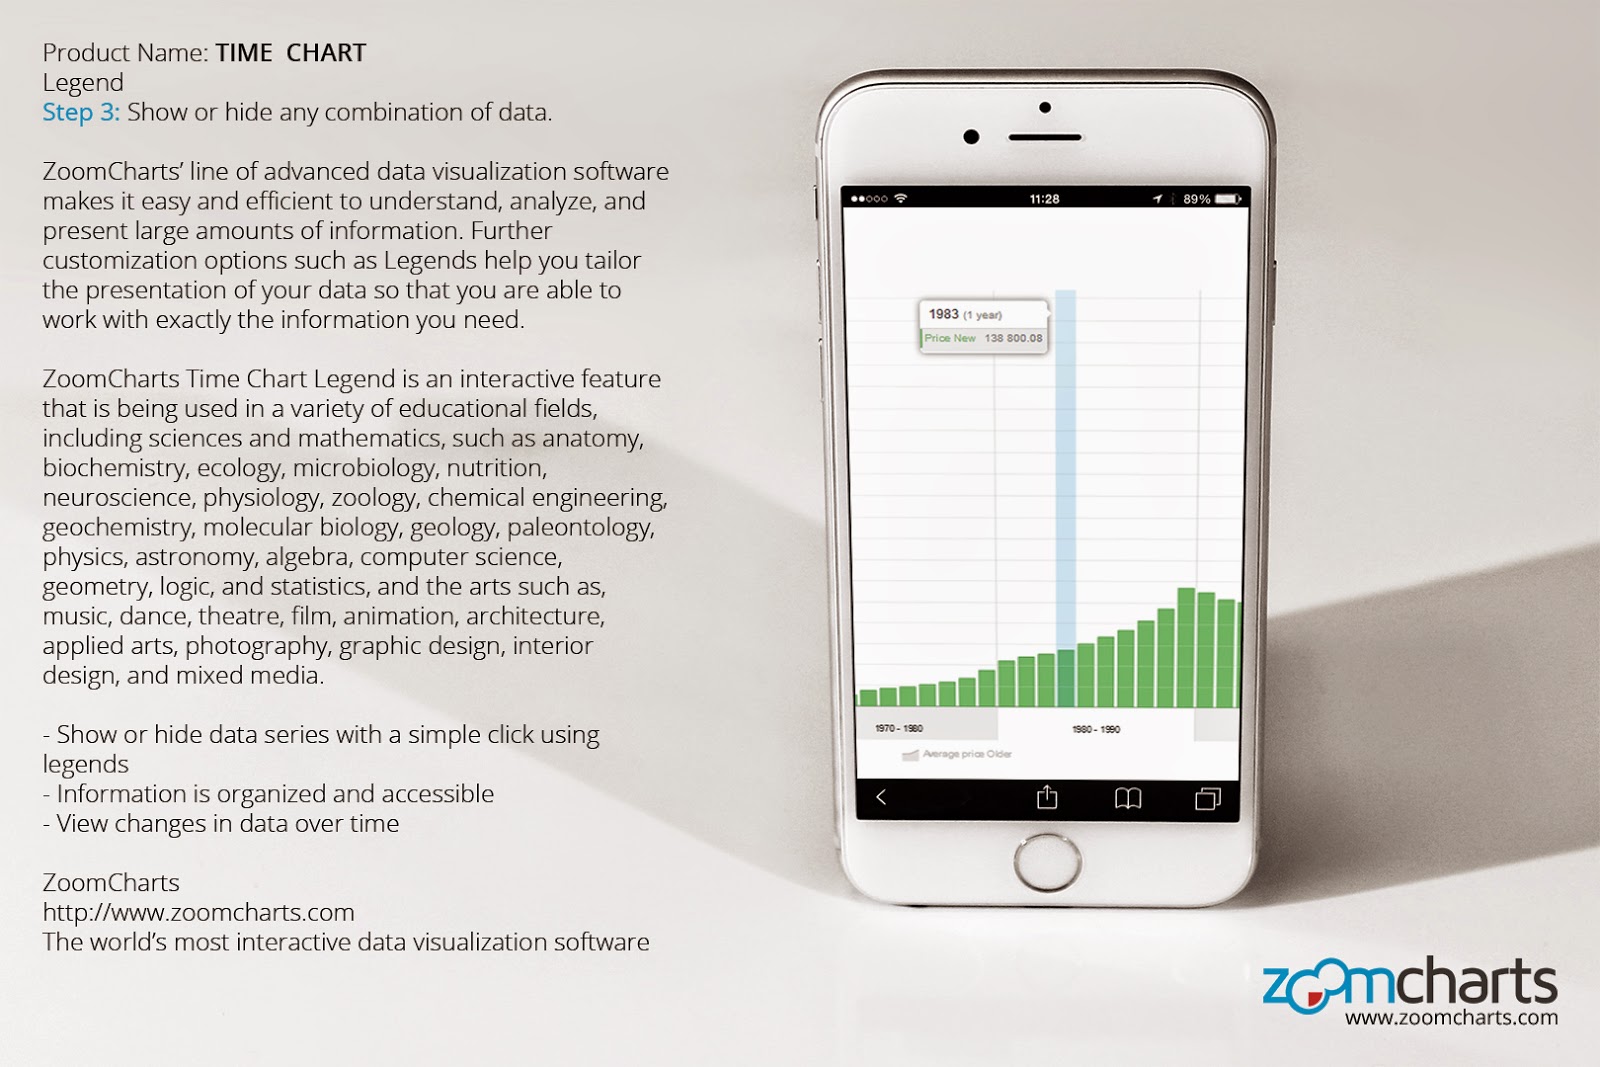
Step 3 Show or hide any combination of data.
Step 4 Sort and display data by various time increments using the filters at the top right.

Step 5 Zoom in and out of the chart by swiping up or down with your mouse scroll pad, or by using the Zoom-out feature at the top left.
Check out ZoomCharts products:
Network Chart
Big network exploration
Explore linked data sets. Highlight relevant data with dynamic filters and visual styles. Incremental data loading. Exploration with focus nodes.
Time Chart
Time navigation and exploration tool
Browse activity logs, select time ranges. Multiple data series and value axes. Switch between time units.
Pie Chart
Amazingly intuitive hierarchical data exploration
Get quick overview of your data and drill down when necessary. All in a single easy to use chart.
Facet Chart
Scrollable bar chart with drill-down
Compare values side by side and provide easy access to the long tail.
ZoomCharts
http://www.zoomcharts.com
The world’s most interactive data visualization software
Monday, March 30, 2015
How to Get Seemingly Unmanageable Big Data Under Control

A few short years ago, it would be impossible to predict the precise way in which data has evolved, and just how much data we generate today. To say it has increased in the last few years would be an understatement. There has been exponential growth of new data, now commonly referred to as Big Data. It’s not that big data didn’t exist before; it’s just that it’s much, much bigger now, and it’s being generated at much faster rates, thanks to modern technology.
For example, YouTube alone boasts over 1 billion users, 300 hours of video uploaded every minute, and hundreds of millions of hours of video content watched and billions of views generated every single day. And that’s just one website.
According to IBM, we generate 2.5 quintillion bytes of data every day. We are practically drowning in new data, at every second, and unless something is being done with it, all this data is rendered essentially useless. Since this is a trend that is not going away any time soon, how are we able to deal with it all?
Analyzing the data we generate, particularly online data, is an integral part of how businesses run today. It is important for businesses to understand and analyze information in order to use it to grow their company, and become more efficient with business decisions.
Moreover, because much of the data available today is user generated, with everything from emails and clicks, to tweets and Facebook posts, to uploaded photos and videos, it is all being used to gather information on clients and customers, to figure out their interests and habits, market and advertise to them, for the ultimate goal of generating sales from them.
This is why data visualization software, such as ZoomCharts charts and graphs, has been invaluable in making it easy to analyze, understand, and present data. ZoomCharts tools are completely interactive, support massive data sets, work on all modern devices including touch screens, and perform at incredibly fast speeds, to ensure that you are in total control of your data, and not the other way around.
Check out ZoomCharts products:
Network Chart
Big network exploration
Explore linked data sets. Highlight relevant data with dynamic filters and visual styles. Incremental data loading. Exploration with focus nodes.
Time Chart
Time navigation and exploration tool
Browse activity logs, select time ranges. Multiple data series and value axes. Switch between time units.
Pie Chart
Amazingly intuitive hierarchical data exploration
Get quick overview of your data and drill down when necessary. All in a single easy to use chart.
Facet Chart
Scrollable bar chart with drill-down
Compare values side by side and provide easy access to the long tail.
ZoomCharts
http://www.zoomcharts.com
The world’s most interactive data visualization software
Tuesday, March 24, 2015
Presentation on How to Increase Sales with ZoomCharts
ZoomCharts CEO and Co-Founder Janis Volbergs gave an engaging presentation on the startup path from idea, to market, to investment, and what it takes to build a product from the ground up and take it to a new level.


Full PowerPoint presentation:
http://www.slideshare.net/zoomcharts/increase-your-sales-with-zoomcharts


How did it all start?
A problem was spotted. There were no visualization libraries delivering truly interactive charts for touch enabled devices that were capable of working with big data.
And so the idea emerged. This was the right time to build such a library.
Why?
Because touch screen displays will become a $31.9 billion dollar market by 2018. Smart mobile sensor devices were used by 1.75 billion people in 2014. The Big Data market will grow exponentially (from $8.8 billion in 2013), to $48 billion in 2018. HTML5 adoption is wide enough and touch enabled devices are powerful enough to generate interactive visualizations.
The ingredients for a successful startup include:
1. A grand vision. ZoomCharts’ vision is to become the number one SDK for interactive chart development in web and mobile apps.
2. A realistic plan for execution and getting your vision implemented.
3. (Most importantly) A team, able to see the grand vision and execute the plan.
ZoomCharts started small, but focused. A vision was set, a core team of professionals was assembled, and a detailed business plan was derived, which led to a €200,000 seed investment.
The product was created in less than a year, and launched public downloads and a shop in March 2014.
In less than a year, the customer list grew to include companies such as TCI Business Capital, Hewlett Packard, D8 Corporation, Proteus Enterprise, Narus, SwissLife, Taykey, Derivitec, Sensors, Click & Pledge, Ryan Scientific, Inc., Booxs, Frostbyte Consulting, Image webdesign, Norbit, Helm, Zengo, Ense Group, RCS, Helbling, Loonloon, Fractalerts, Thinktecture, bitmama, KeeSystem, Trulia, Maxfone, and many more.
ZoomCharts started with a €0 investment in dedicated marketing. A follow up investment of €500,000 raised in November 2014 enabled us to scale our team from 3 to 11, and get us moving forward fast.
Today, the ZoomCharts team has grown from 3 to 11, and has raised a total investment of €700,000. We’ve reached 40 paying customers, and growing, and there have been over 700 trials started, and growing.
Current challenges include brand building, marketing and sales, and incorporation into the US, including patents.
Despite the challenges, ZoomCharts is excited about the company’s future, which includes plans such as:
1. Raise €5-7 million to massively expand sales and marketing.
2. Expand the team to 40+ within the next two years.
3. Launch multiple SAAS solutions that would let a much wider audience take advantage of the benefits ZoomCharts provides.
We are proud to be part of ZoomCharts, and we are glad to hear that our customers love ZoomCharts as much as we do!
Check out ZoomCharts products:
Network Chart
Big network exploration
Explore linked data sets. Highlight relevant data with dynamic filters and visual styles. Incremental data loading. Exploration with focus nodes.
Time Chart
Time navigation and exploration tool
Browse activity logs, select time ranges. Multiple data series and value axes. Switch between time units.
Pie Chart
Amazingly intuitive hierarchical data exploration
Get quick overview of your data and drill down when necessary. All in a single easy to use chart.
Facet Chart
Scrollable bar chart with drill-down
Compare values side by side and provide easy access to the long tail.
ZoomCharts
http://www.zoomcharts.com
The world’s most interactive data visualization software
Full PowerPoint presentation:
http://www.slideshare.net/zoomcharts/increase-your-sales-with-zoomcharts
How did it all start?
A problem was spotted. There were no visualization libraries delivering truly interactive charts for touch enabled devices that were capable of working with big data.
And so the idea emerged. This was the right time to build such a library.
Why?
Because touch screen displays will become a $31.9 billion dollar market by 2018. Smart mobile sensor devices were used by 1.75 billion people in 2014. The Big Data market will grow exponentially (from $8.8 billion in 2013), to $48 billion in 2018. HTML5 adoption is wide enough and touch enabled devices are powerful enough to generate interactive visualizations.
The ingredients for a successful startup include:
1. A grand vision. ZoomCharts’ vision is to become the number one SDK for interactive chart development in web and mobile apps.
2. A realistic plan for execution and getting your vision implemented.
3. (Most importantly) A team, able to see the grand vision and execute the plan.
ZoomCharts started small, but focused. A vision was set, a core team of professionals was assembled, and a detailed business plan was derived, which led to a €200,000 seed investment.
The product was created in less than a year, and launched public downloads and a shop in March 2014.
In less than a year, the customer list grew to include companies such as TCI Business Capital, Hewlett Packard, D8 Corporation, Proteus Enterprise, Narus, SwissLife, Taykey, Derivitec, Sensors, Click & Pledge, Ryan Scientific, Inc., Booxs, Frostbyte Consulting, Image webdesign, Norbit, Helm, Zengo, Ense Group, RCS, Helbling, Loonloon, Fractalerts, Thinktecture, bitmama, KeeSystem, Trulia, Maxfone, and many more.
ZoomCharts started with a €0 investment in dedicated marketing. A follow up investment of €500,000 raised in November 2014 enabled us to scale our team from 3 to 11, and get us moving forward fast.
Today, the ZoomCharts team has grown from 3 to 11, and has raised a total investment of €700,000. We’ve reached 40 paying customers, and growing, and there have been over 700 trials started, and growing.
Current challenges include brand building, marketing and sales, and incorporation into the US, including patents.
Despite the challenges, ZoomCharts is excited about the company’s future, which includes plans such as:
1. Raise €5-7 million to massively expand sales and marketing.
2. Expand the team to 40+ within the next two years.
3. Launch multiple SAAS solutions that would let a much wider audience take advantage of the benefits ZoomCharts provides.
We are proud to be part of ZoomCharts, and we are glad to hear that our customers love ZoomCharts as much as we do!
Check out ZoomCharts products:
Network Chart
Big network exploration
Explore linked data sets. Highlight relevant data with dynamic filters and visual styles. Incremental data loading. Exploration with focus nodes.
Time Chart
Time navigation and exploration tool
Browse activity logs, select time ranges. Multiple data series and value axes. Switch between time units.
Pie Chart
Amazingly intuitive hierarchical data exploration
Get quick overview of your data and drill down when necessary. All in a single easy to use chart.
Facet Chart
Scrollable bar chart with drill-down
Compare values side by side and provide easy access to the long tail.
ZoomCharts
http://www.zoomcharts.com
The world’s most interactive data visualization software
Monday, March 16, 2015
How to Use ZoomCharts Net Chart - Interactive Node Filtering on Mac
https://zoomcharts.com/en/gallery/all:node-filter


Feel free to play around with the ZoomCharts Net Chart - Interactive Node Filtering on iPhone:
ZoomCharts’ advanced data visualization software makes viewing and analyzing your data easier than ever before. The Node Filtering tool features an easy to use slider that lets you view exactly the data you need while temporarily hiding others based on the filtering options of your choice.
ZoomCharts’ Interactive Node Filtering feature is currently being used to enhance data visualization in a number of educational fields, including sciences and mathematics, such as anatomy, biochemistry, ecology, microbiology, nutrition, neuroscience, physiology, zoology, chemical engineering, geochemistry, molecular biology, geology, paleontology, physics, astronomy, algebra, computer science, geometry, logic, and statistics, and the arts such as, music, dance, theatre, film, animation, architecture, applied arts, photography, graphic design, interior design, and mixed media.
- Customize your graph to view exactly what you want
- Filter and view data easily using a slider
- Change node display with simple drag and drop
Step 1 Use the slider to filter the data you want displayed.

Step 2 Drag and drop nodes to rearrange the graph.

Step 3 Zoom in and out of the graph by swiping up or down with your mouse scroll pad.

Step 4 Move the slider points back to the ends to display full data set.

Check out ZoomCharts products:
Network Chart
Big network exploration
Explore linked data sets. Highlight relevant data with dynamic filters and visual styles. Incremental data loading. Exploration with focus nodes.
Time Chart
Time navigation and exploration tool
Browse activity logs, select time ranges. Multiple data series and value axes. Switch between time units.
Pie Chart
Amazingly intuitive hierarchical data exploration
Get quick overview of your data and drill down when necessary. All in a single easy to use chart.
Facet Chart
Scrollable bar chart with drill-down
Compare values side by side and provide easy access to the long tail. ZoomCharts
http://www.zoomcharts.com
The world’s most interactive data visualization software
Feel free to play around with the ZoomCharts Net Chart - Interactive Node Filtering on iPhone:
ZoomCharts’ advanced data visualization software makes viewing and analyzing your data easier than ever before. The Node Filtering tool features an easy to use slider that lets you view exactly the data you need while temporarily hiding others based on the filtering options of your choice.
ZoomCharts’ Interactive Node Filtering feature is currently being used to enhance data visualization in a number of educational fields, including sciences and mathematics, such as anatomy, biochemistry, ecology, microbiology, nutrition, neuroscience, physiology, zoology, chemical engineering, geochemistry, molecular biology, geology, paleontology, physics, astronomy, algebra, computer science, geometry, logic, and statistics, and the arts such as, music, dance, theatre, film, animation, architecture, applied arts, photography, graphic design, interior design, and mixed media.
- Customize your graph to view exactly what you want
- Filter and view data easily using a slider
- Change node display with simple drag and drop
Step 1 Use the slider to filter the data you want displayed.
Step 2 Drag and drop nodes to rearrange the graph.
Step 3 Zoom in and out of the graph by swiping up or down with your mouse scroll pad.
Step 4 Move the slider points back to the ends to display full data set.
Check out ZoomCharts products:
Network Chart
Big network exploration
Explore linked data sets. Highlight relevant data with dynamic filters and visual styles. Incremental data loading. Exploration with focus nodes.
Time Chart
Time navigation and exploration tool
Browse activity logs, select time ranges. Multiple data series and value axes. Switch between time units.
Pie Chart
Amazingly intuitive hierarchical data exploration
Get quick overview of your data and drill down when necessary. All in a single easy to use chart.
Facet Chart
Scrollable bar chart with drill-down
Compare values side by side and provide easy access to the long tail. ZoomCharts
http://www.zoomcharts.com
The world’s most interactive data visualization software
Friday, March 13, 2015
How to Use ZoomCharts Net Chart - Interactive Node Filtering on iPhone
https://zoomcharts.com/en/gallery/all:node-filter
Feel free to play around with the ZoomCharts Net Chart - Interactive Node Filtering on iPhone:
ZoomCharts’ advanced data visualization software makes viewing and analyzing your data easier than ever before. The Node Filtering tool features an easy to use slider that lets you view exactly the data you need while temporarily hiding others based on the filtering options of your choice.
ZoomCharts’ Interactive Node Filtering feature is currently being used to enhance data visualization in a number of educational fields, including sciences and mathematics, such as anatomy, biochemistry, ecology, microbiology, nutrition, neuroscience, physiology, zoology, chemical engineering, geochemistry, molecular biology, geology, paleontology, physics, astronomy, algebra, computer science, geometry, logic, and statistics, and the arts such as, music, dance, theatre, film, animation, architecture, applied arts, photography, graphic design, interior design, and mixed media.
- Customize your graph to view exactly what you want
- Filter and view data easily using a slider
- Change node display with simple drag and drop
Step 1 Use the slider to filter the data you want displayed.

Step 2 Drag and drop nodes to rearrange the graph.

Step 3 Zoom in and out of the graph by swiping up or down with your mouse scroll pad.

Step 4 Move the slider points back to the ends to display full data set.

Check out ZoomCharts products:
Network Chart
Big network exploration
Explore linked data sets. Highlight relevant data with dynamic filters and visual styles. Incremental data loading. Exploration with focus nodes.
Time Chart
Time navigation and exploration tool
Browse activity logs, select time ranges. Multiple data series and value axes. Switch between time units.
Pie Chart
Amazingly intuitive hierarchical data exploration
Get quick overview of your data and drill down when necessary. All in a single easy to use chart.
Facet Chart
Scrollable bar chart with drill-down
Compare values side by side and provide easy access to the long tail. ZoomCharts
http://www.zoomcharts.com
The world’s most interactive data visualization software
Feel free to play around with the ZoomCharts Net Chart - Interactive Node Filtering on iPhone:
ZoomCharts’ advanced data visualization software makes viewing and analyzing your data easier than ever before. The Node Filtering tool features an easy to use slider that lets you view exactly the data you need while temporarily hiding others based on the filtering options of your choice.
ZoomCharts’ Interactive Node Filtering feature is currently being used to enhance data visualization in a number of educational fields, including sciences and mathematics, such as anatomy, biochemistry, ecology, microbiology, nutrition, neuroscience, physiology, zoology, chemical engineering, geochemistry, molecular biology, geology, paleontology, physics, astronomy, algebra, computer science, geometry, logic, and statistics, and the arts such as, music, dance, theatre, film, animation, architecture, applied arts, photography, graphic design, interior design, and mixed media.
- Customize your graph to view exactly what you want
- Filter and view data easily using a slider
- Change node display with simple drag and drop
Step 1 Use the slider to filter the data you want displayed.
Step 2 Drag and drop nodes to rearrange the graph.
Step 3 Zoom in and out of the graph by swiping up or down with your mouse scroll pad.
Step 4 Move the slider points back to the ends to display full data set.
Check out ZoomCharts products:
Network Chart
Big network exploration
Explore linked data sets. Highlight relevant data with dynamic filters and visual styles. Incremental data loading. Exploration with focus nodes.
Time Chart
Time navigation and exploration tool
Browse activity logs, select time ranges. Multiple data series and value axes. Switch between time units.
Pie Chart
Amazingly intuitive hierarchical data exploration
Get quick overview of your data and drill down when necessary. All in a single easy to use chart.
Facet Chart
Scrollable bar chart with drill-down
Compare values side by side and provide easy access to the long tail. ZoomCharts
http://www.zoomcharts.com
The world’s most interactive data visualization software
Subscribe to:
Posts (Atom)