Showing posts with label zoom in. Show all posts

Monday, May 18, 2015

How to use ZoomCharts Facet Chart - Browser Shares, Hierarchical Structure for iPhone

https://zoomcharts.com/en/gallery/all:facet-chart-browser-shares


The Facet Chart Hierarchical Structure tool, part of ZoomCharts’ advanced data visualization line of software, makes presenting and analyzing large amounts of data simple and visually appealing. Work more efficiently with your data by organizing it to fit your company’s exact needs.

Hierarchical Structure is one of the many advanced data visualization features being offered by ZoomCharts and used by clients in several educational fields, including sciences and mathematics, such as anatomy, biochemistry, ecology, microbiology, nutrition, neuroscience, physiology, zoology, chemical engineering, geochemistry, molecular biology, geology, paleontology, physics, astronomy, algebra, computer science, geometry, logic, and statistics, and the arts such as, music, dance, theatre, film, animation, architecture, applied arts, photography, graphic design, interior design, and mixed media.

- Interactive data representation lets you visualize large amounts of information
- View data in hierarchical order for an organized display
- Present detailed information about your data series easily and efficiently

Step 1 Order your chart’s data by hierarchy.


Step 2 Hover over a data series to display detailed information.


Step 3 Click on a data series to expand.


Step 4 Zoom in and out of the chart by swiping up or down with your mouse scroll pad, or by using the Zoom-out feature at the top left.


Step 5 Go back to the full data display using the Back feature at the top left.


Check out ZoomCharts products:

Network Chart
Big network exploration
Explore linked data sets. Highlight relevant data with dynamic filters and visual styles. Incremental data loading. Exploration with focus nodes.

Time Chart
Time navigation and exploration tool
Browse activity logs, select time ranges. Multiple data series and value axes. Switch between time units.

Pie Chart
Amazingly intuitive hierarchical data exploration
Get quick overview of your data and drill down when necessary. All in a single easy to use chart.

Facet Chart
Scrollable bar chart with drill-down
Compare values side by side and provide easy access to the long tail.

ZoomCharts
http://www.zoomcharts.com
The world’s most interactive data visualization software

Tuesday, March 31, 2015

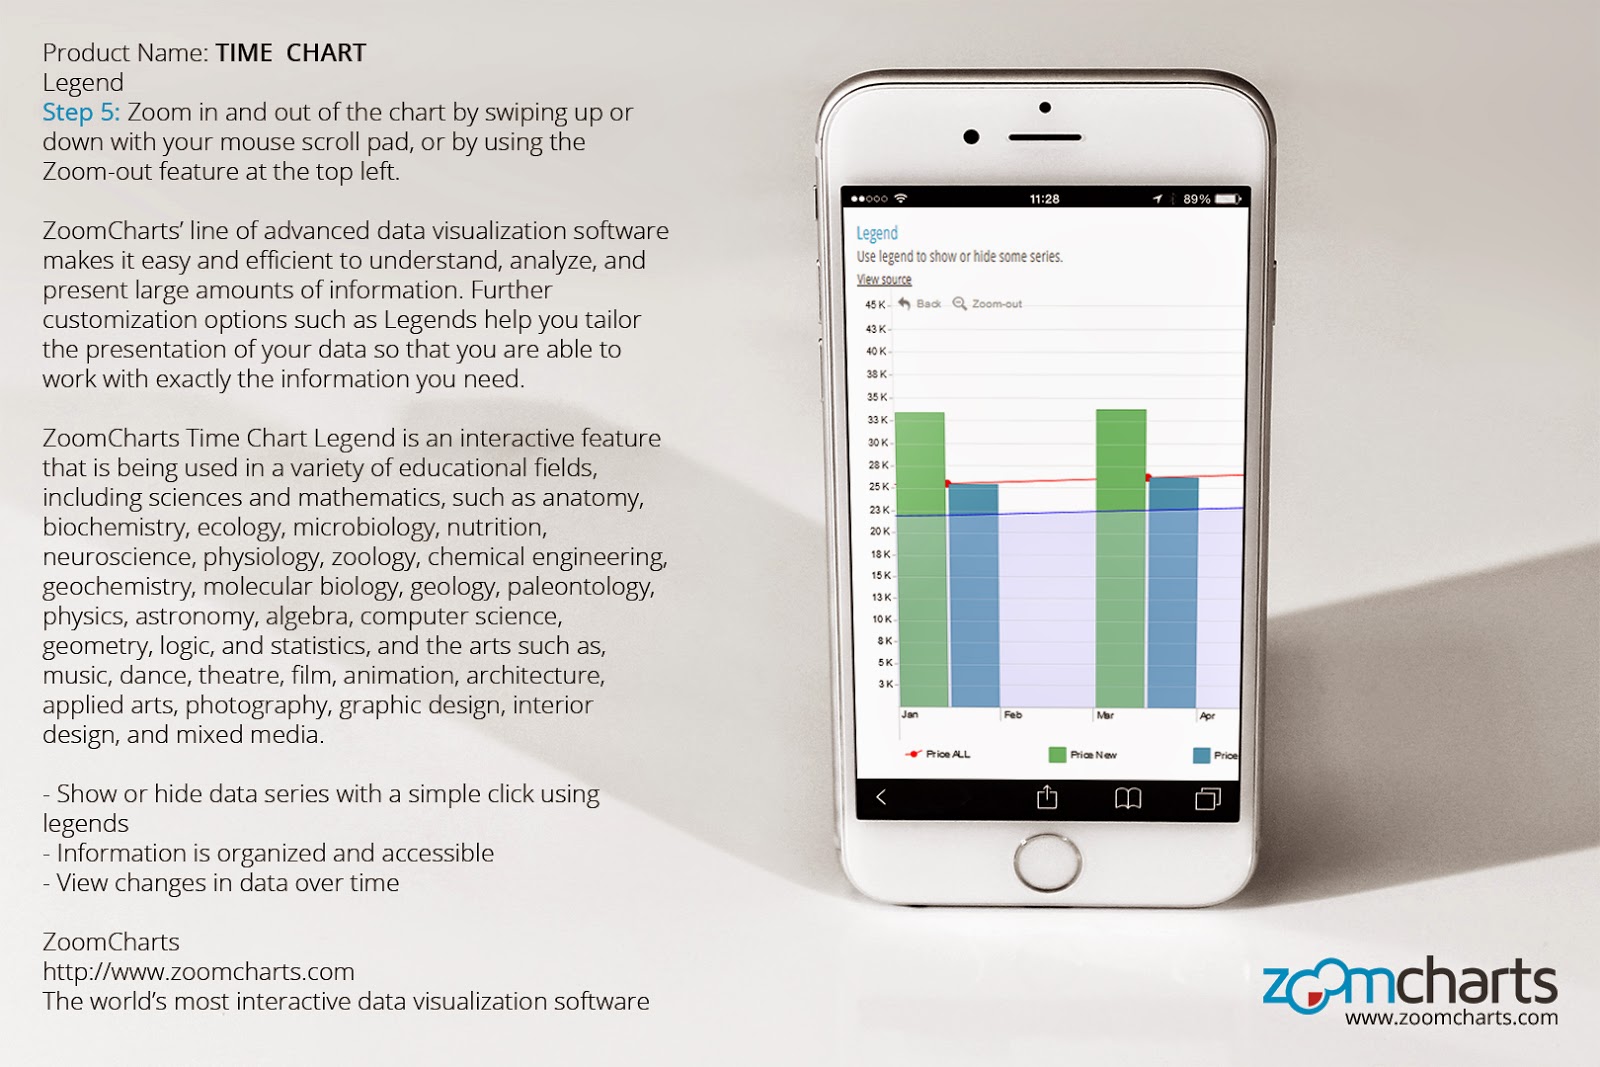
How to Use ZoomCharts Time Chart Legend on iPhone


https://zoomcharts.com/en/gallery/all:time-chart-legend

ZoomCharts’ line of advanced data visualization software makes it easy and efficient to understand, analyze, and present large amounts of information. Further customization options such as Legends help you tailor the presentation of your data so that you are able to work with exactly the information you need.

ZoomCharts Time Chart Legend is an interactive feature that is being used in a variety of educational fields, including sciences and mathematics, such as anatomy, biochemistry, ecology, microbiology, nutrition, neuroscience, physiology, zoology, chemical engineering, geochemistry, molecular biology, geology, paleontology, physics, astronomy, algebra, computer science, geometry, logic, and statistics, and the arts such as, music, dance, theatre, film, animation, architecture, applied arts, photography, graphic design, interior design, and mixed media.

- Show or hide data series with a simple click using legends
- Information is organized and accessible
- View changes in data over time


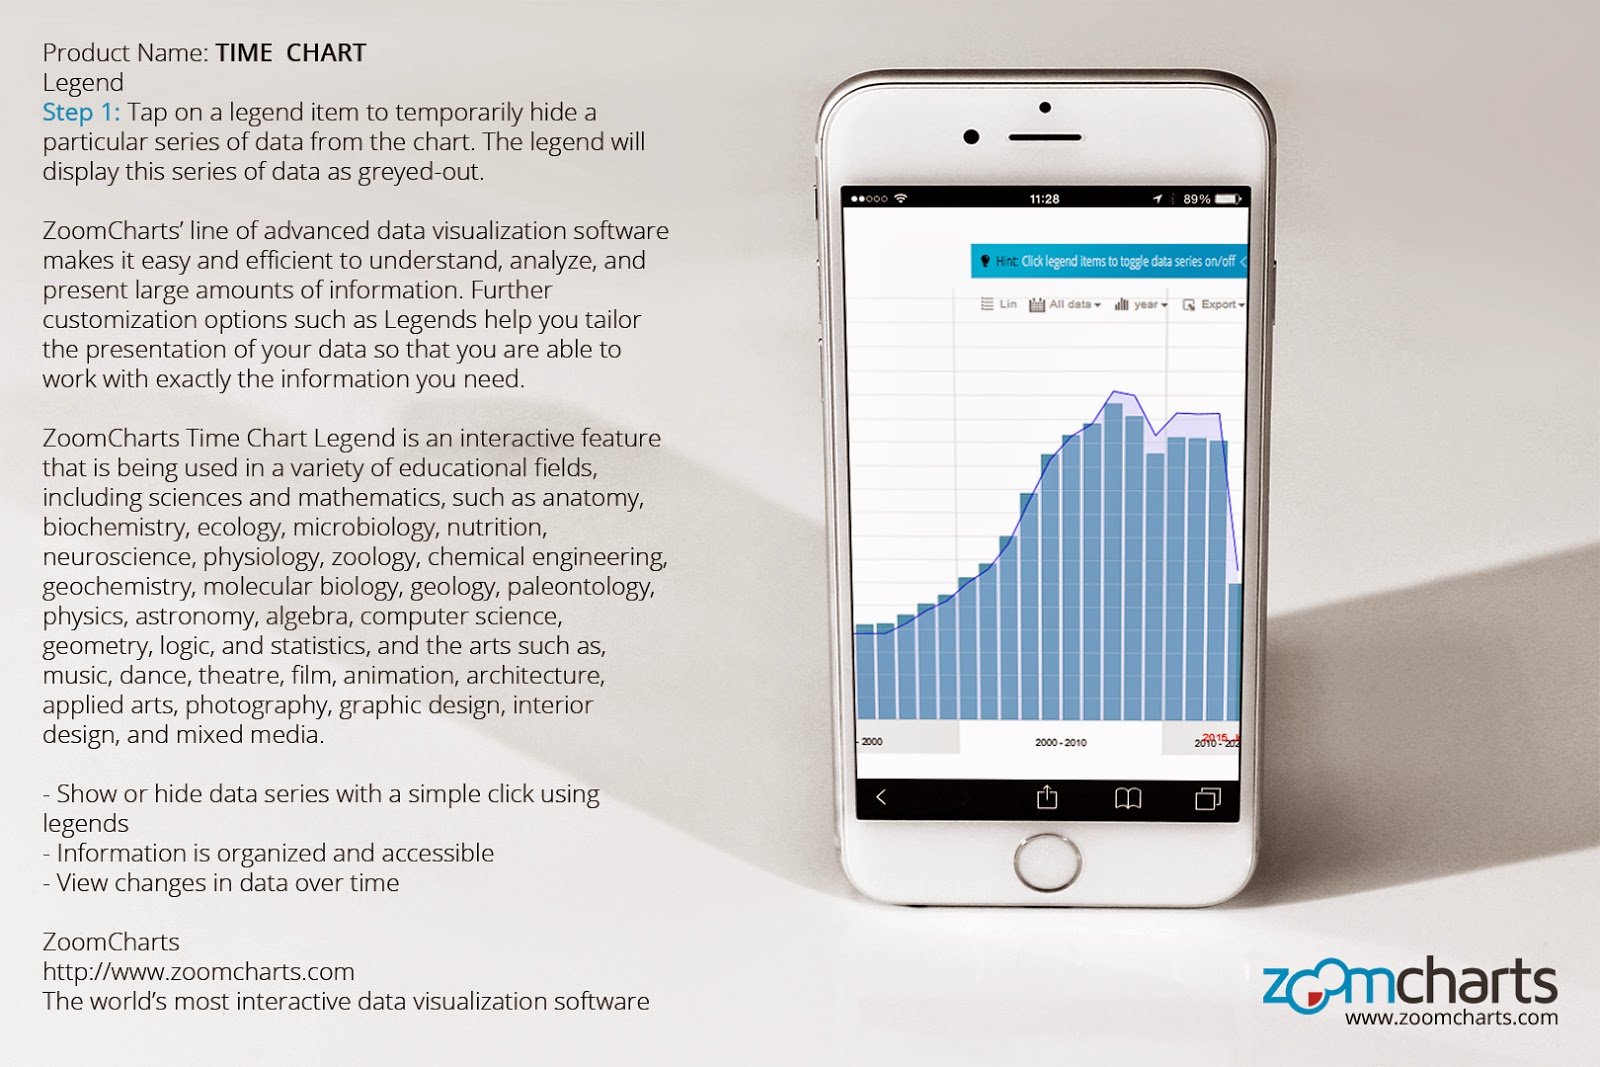
Step 1 Tap on a legend item to temporarily hide a particular series of data from the chart. The legend will display this series of data as greyed-out.


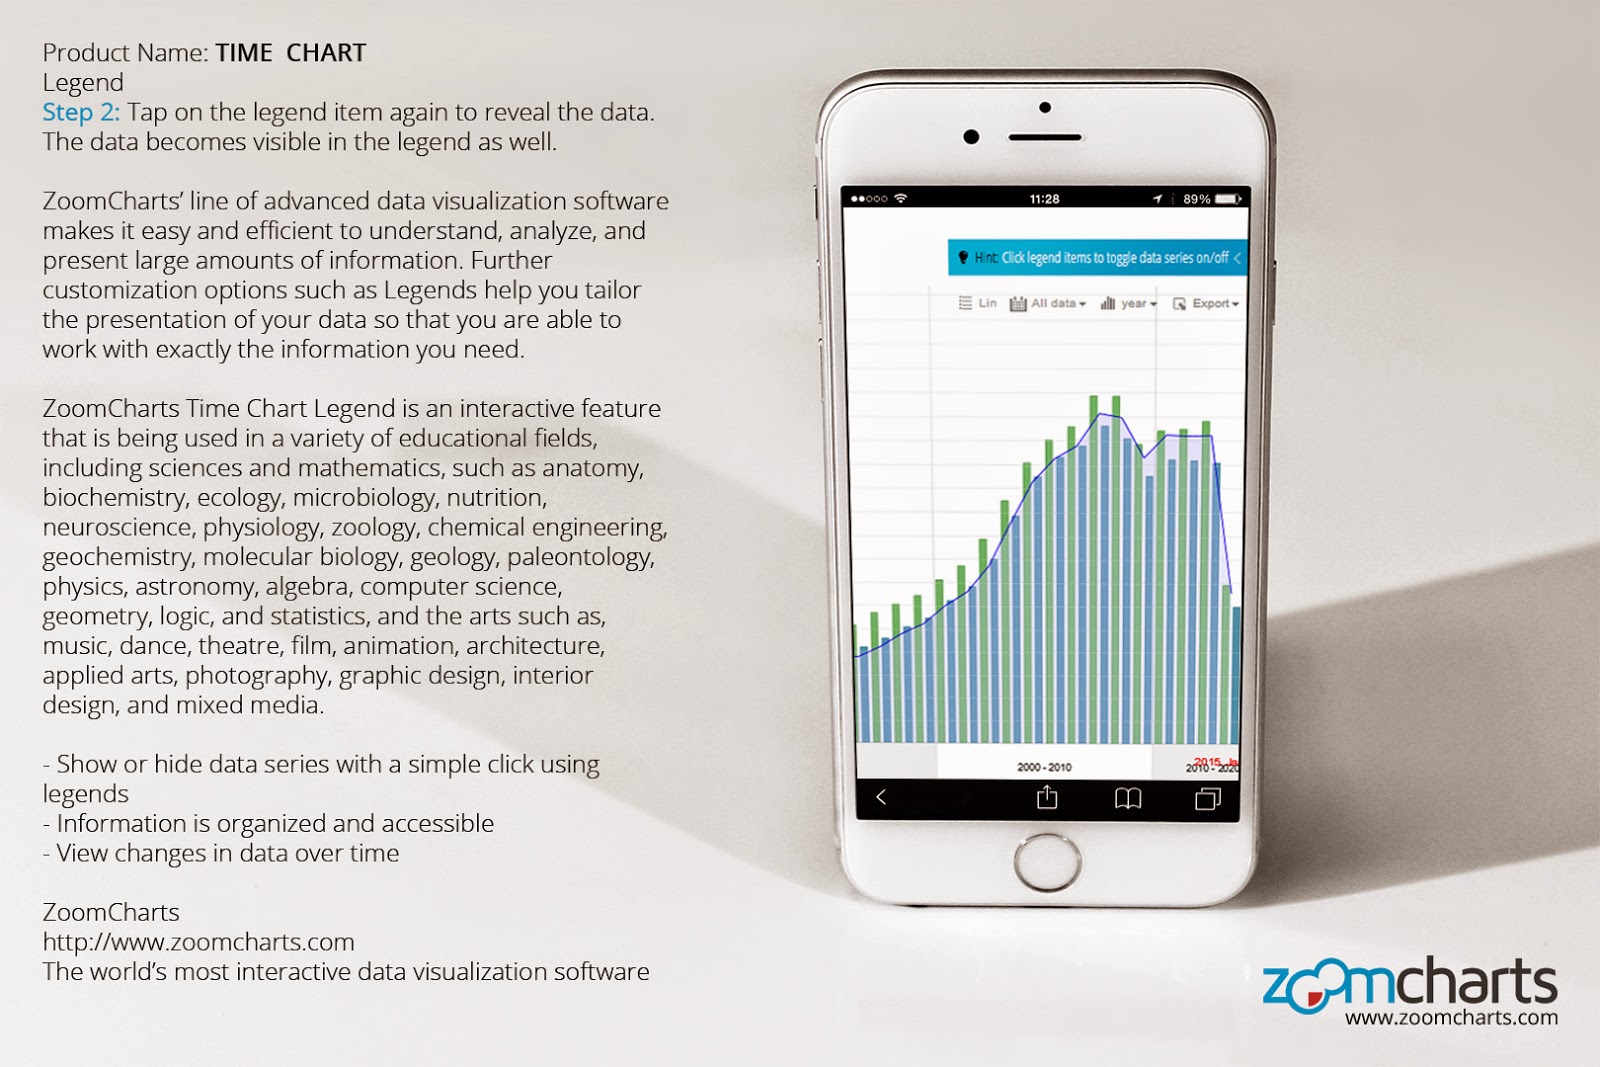
Step 2 Tap on the legend item again to reveal the data. The data becomes visible in the legend as well.


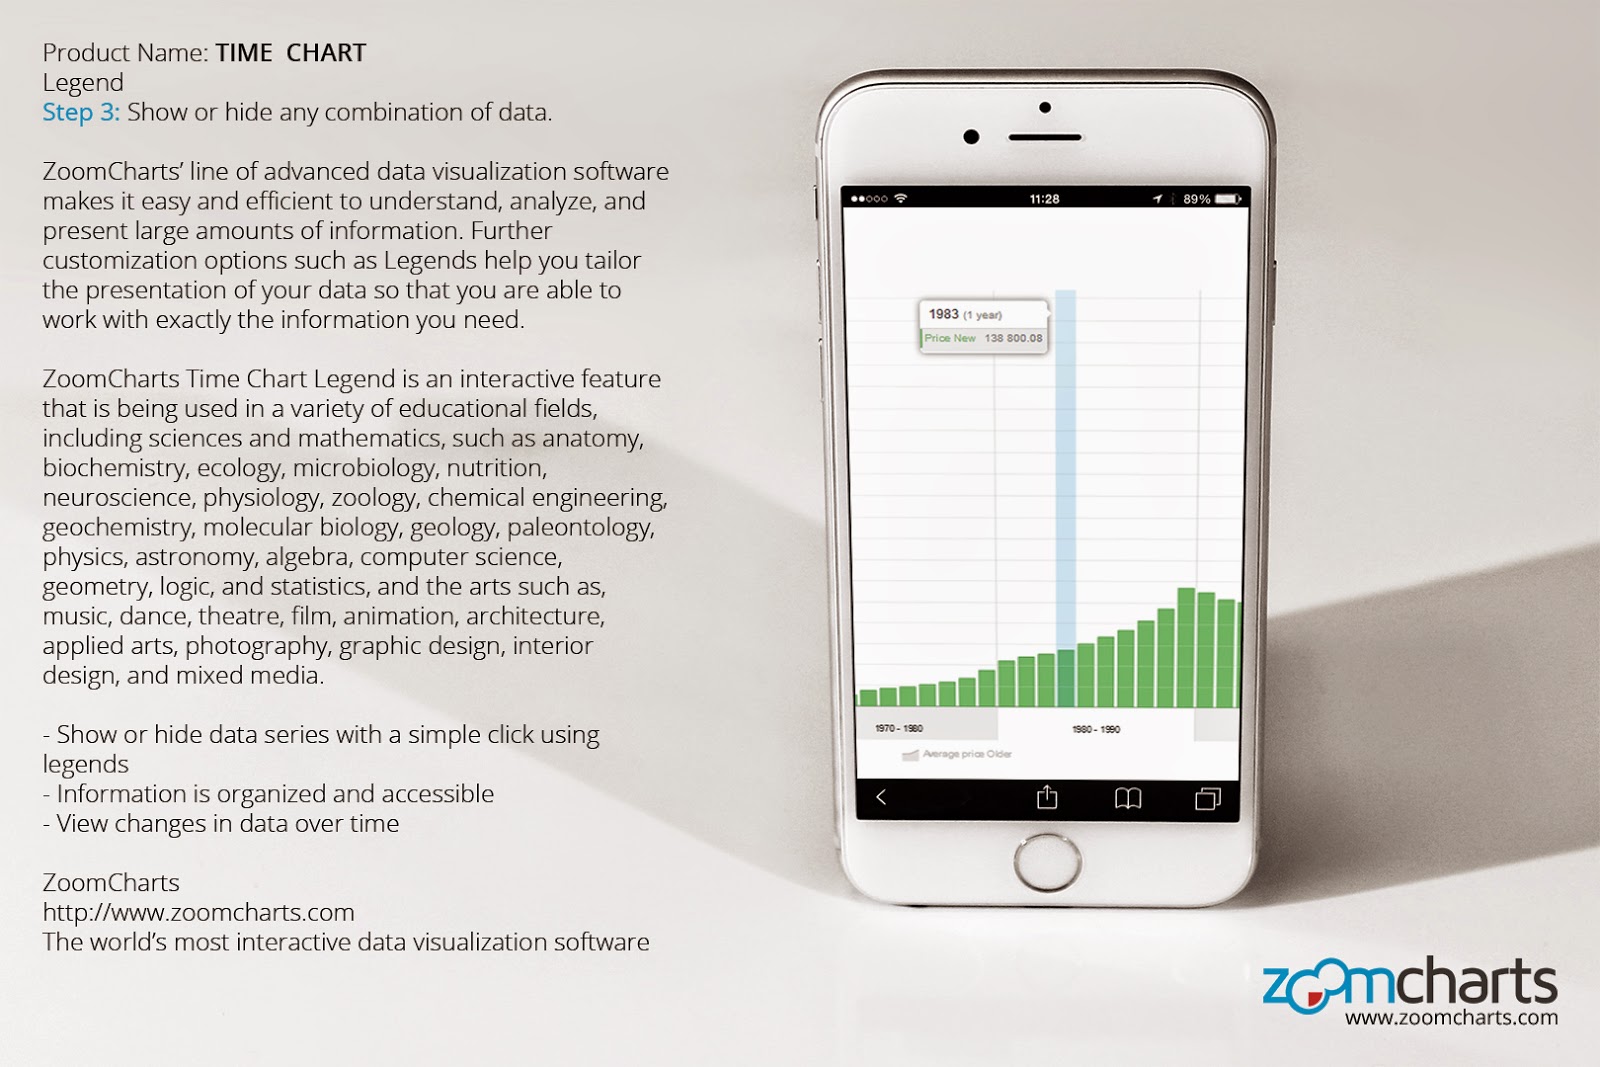
Step 3 Show or hide any combination of data.


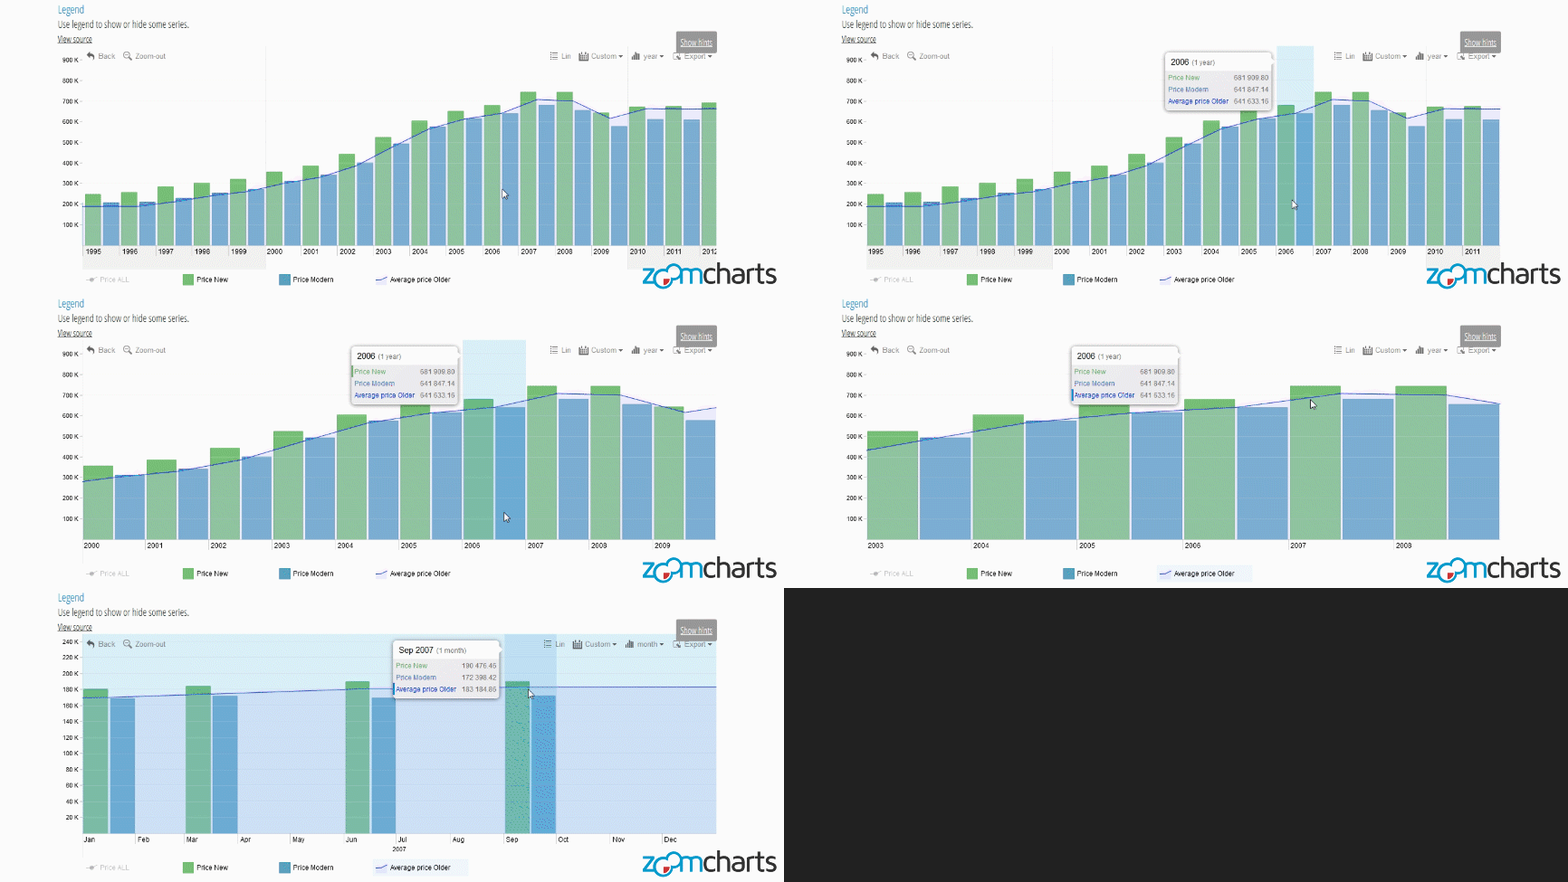
Step 4 Sort and display data by various time increments using the filters at the top right.


Step 5 Zoom in and out of the chart by swiping up or down with your mouse scroll pad, or by using the Zoom-out feature at the top left.


Check out ZoomCharts products:

Network Chart
Big network exploration
Explore linked data sets. Highlight relevant data with dynamic filters and visual styles. Incremental data loading. Exploration with focus nodes.

Time Chart
Time navigation and exploration tool
Browse activity logs, select time ranges. Multiple data series and value axes. Switch between time units.

Pie Chart
Amazingly intuitive hierarchical data exploration
Get quick overview of your data and drill down when necessary. All in a single easy to use chart.

Facet Chart
Scrollable bar chart with drill-down
Compare values side by side and provide easy access to the long tail.

ZoomCharts
http://www.zoomcharts.com
The world’s most interactive data visualization software